
Data Interpretation and Arithmetical Reasoning Test is an important part of IQ and Logical Reasoning that tests your ability to interpret data, perform calculations, and solve problems using logical and mathematical reasoning.
For Officer Cadet Entrance Exam preparation, these questions help develop numerical ability, analytical thinking, data interpretation, and logical reasoning skills. Explore the complete Officer Cadet Exam resources and IQ for Officer Cadet preparation for additional practice and study materials.
- What is Data Interpretation and Arithmetical Reasoning Test?
- What Skills Do These Questions Measure?
- Important Terms and Definitions
- Types of Data Interpretation and Arithmetical Reasoning Questions
- How to Solve These Questions
- Effective Tricks to Solve These Questions
- Important Tips to Solve These Questions
- Practice Questions
- Conclusion
- Related Resources
What is Data Interpretation and Arithmetical Reasoning Test?
Data Interpretation (DI) is indeed about reading charts, tables, graphs or caselets (short written passages with data) and answering questions from them. The skills you list, such as numerical ability, logical reasoning and quick, accurate calculation, are the standard ones tested.
Example:
The table shows a shop’s sales (in units) over four months.
| Month | Phones | Laptops |
| Jan | 120 | 80 |
| Feb | 150 | 90 |
| Mar | 180 | 110 |
| Apr | 150 | 120 |
Q1. What is the total number of phones sold over the four months?
120 + 150 + 180 + 150 = 600
Answer: 600
Q2. By what percentage did laptop sales increase from January to April?
Increase = 120 − 80 = 40
Percentage = (40 ÷ 80) × 100 = 50%
Answer: 50%
Arithmetical Reasoning Test involves solving logical problems using basic arithmetic operations — addition, subtraction, multiplication, division, percentages, ratios, and averages — applied to real-world scenarios and logical puzzles.
Example:
The sum of the ages of a father and son is 60 years. Five years ago, the father’s age was five times the son’s age. Find their present ages.
Solution:
Let the son’s present age = x years
Then the father’s present age = 60 − x years
Five years ago:
Son’s age = x − 5
Father’s age = (60 − x) − 5 = 55 − x
According to the condition:
55 − x = 5(x − 5)
x = 13⅓
Son’s present age = 13⅓ years
Father’s present age = 60 − 13⅓ = 46⅔ years
Answer: Son = 13⅓ years, Father = 46⅔ years
What Skills Do These Questions Measure?
Data interpretation and arithmetical reasoning questions test your ability in:
👉 Analytical and logical thinking – working through multi-step problems methodically.
👉 Numerical ability and calculation speed – performing accurate arithmetic quickly.
👉 Visual analysis of data – reading charts, tables, and graphs correctly.
👉 Quick approximation skills – estimating when exact precision isn’t required.
👉 Decision-making based on given data – drawing the right conclusion from what’s presented.
Why This Topic Is High-Scoring
👉 This combined topic is high-scoring in the Numerical Reasoning section because it tests both analytical skills and numerical ability together.
Important Terms and Definitions
👉 Data Interpretation – analyzing and interpreting data from charts, tables, graphs, or caselets to answer questions.
👉 Arithmetical Reasoning – solving logical problems using basic arithmetic operations and mathematical concepts.
👉 Bar graph – a chart presenting data using rectangular bars of varying heights or lengths.
👉 Pie chart – a circular chart divided into sectors, each representing a proportion of the whole.
👉 Line graph – a chart displaying data points connected by lines, typically showing a trend over time.
👉 Table – a structured format presenting numerical data in rows and columns.
👉 Caselet DI – data presented in paragraph form without any visual representation.
👉 Percentage change – the change between two values expressed as a percentage.
👉 Average (arithmetic mean) – the sum of all values divided by the number of values.
👉 Ratio – a comparative relation between two quantities.
Types of Data Interpretation and Arithmetical Reasoning Questions
These problems generally fall into a handful of recurring patterns:
1. Direct Table-Based Questions
Reading and calculating information from rows and columns of a table.
| Year | Sales (in lakhs) | Profit (in lakhs) |
|---|---|---|
| 2020 | 100 | 20 |
| 2021 | 120 | 25 |
| 2022 | 150 | 30 |
Question: What is the percentage increase in sales from 2020 to 2022?
Solution:
Increase in sales = 150 − 100 = 50 lakhs
Percentage increase = (Increase ÷ Original Value) × 100
Percentage increase = (50 ÷ 100) × 100
Percentage increase = 50%
Answer: 50%
2. Pie Chart-Based Questions
Converting sector angles into actual values and comparing different categories.
Example:
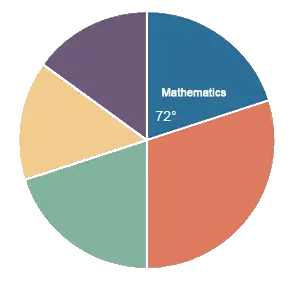
A pie chart shows the distribution of 500 students across five subjects. If the angle for Mathematics is 72°, how many students study Mathematics?
Solution:
Number of students = (Angle ÷ 360°) × Total
Number of students = (72 ÷ 360) × 500
Number of students = 0.2 × 500
Number of students = 100
Answer: 100 students
3. Bar Graph-Based Questions
Comparing bar heights or lengths and calculating differences, ratios, or percentages.
Question
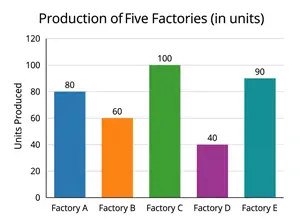
The bar graph shows the production of five factories (in units). What is the percentage by which Factory C’s production exceeds Factory D’s production?
(a) 100% (b) 125% (c) 150% (d) 60%
Solution
Step 1: Read the values from the graph.
Factory C = 100 units
Factory D = 40 units
Step 2: Find the difference.
100 − 40 = 60 units
Step 3: Express it as a percentage of the base (Factory D).
The question asks how much C exceeds D, so D is the base.
Percentage = (60 ÷ 40) × 100 = 150%
Answer: (c) 150%
4. Caselet Data Interpretation
Extracting numerical information from a paragraph and using it to solve the problem.
Question
A school has 1,200 students. 60% of them are boys. Of the boys, 25% play cricket, and of the girls, 30% play cricket. How many students in the school play cricket?
(a) 300 (b) 324 (c) 336 (d) 360
Solution
Step 1: Extract the numbers from the paragraph.
Total students = 1,200
Boys = 60%, so girls = 40%
Boys who play cricket = 25%
Girls who play cricket = 30%
Step 2: Find the boys and girls.
Boys = 1,200 × 60/100 = 720
Girls = 1,200 − 720 = 480
Step 3: Find the cricket players in each group.
Boys: 720 × 25/100 = 180
Girls: 480 × 30/100 = 144
Step 4: Add them.
180 + 144 = 324
Answer: b
5. Age-Based Arithmetical Reasoning
Setting up and solving equations involving the ages of different people.
Question
The sum of the ages of a father and his son is 52 years. Five years ago, the father’s age was five times the son’s age. Find their present ages.
(a) Son 10, Father 42 (b) Son 12, Father 40 (c) Son 13, Father 39 (d) Son 14, Father 38
Solution
Step 1: Set up the variables.
Son’s present age = x
Father’s present age = 52 − x
Step 2: Write the “five years ago” condition.
Son’s age then = x − 5
Father’s age then = (52 − x) − 5 = 47 − x
Step 3: Form the equation.
Father = 5 × Son, so
47 − x = 5(x − 5)
47 − x = 5x − 25
Step 4: Solve.
47 + 25 = 5x + x
72 = 6x
x = 12
So the son is 12 years old and the father is 52 − 12 = 40 years old.
Answer: b
6. Average-Based Questions
Finding unknown values by working forward or backward from a known average.
Question
The average of 6 numbers is 713. Find the sum of all the numbers.
(a) 4,178 (b) 4,278 (c) 4,378 (d) 4,478
Solution
Step 1: Recall the formula.
Average = Sum ÷ Number of observations
So, Sum = Average × Number of observations
Step 2: Substitute the values.
Sum = 713 × 6
Step 3: Calculate.
713 × 6 = (700 × 6) + (13 × 6) = 4,200 + 78 = 4,278
Answer: b
Verification: 4,278 ÷ 6 = 713 ✓
7. Data Checking and Verification
Finding a missing or incorrect value using a known total or other given information.
Question
The table shows the number of books sold by a shop in five months. The total sales over the five months were 1,000 books. Find the number of books sold in April.
| Month | Books Sold |
|---|---|
| January | 180 |
| February | 220 |
| March | 150 |
| April | – |
| May | 260 |
| Total | 1,000 |
(a) 170 (b) 180 (c) 190 (d) 200
Solution
Step 1: Add the known values.
180 + 220 + 150 + 260 = 810
Step 2: Subtract from the total.
Missing value = 1,000 − 810 = 190
Answer: c
Verification: 180 + 220 + 150 + 190 + 260 = 1,000. ✓
8. Mixed Graphs
Interpreting and combining information presented in two different forms, such as a bar graph and a line graph.
Question
A combined chart shows a company’s yearly sales (bars, in ₹ lakh) and profit percentage (line). The values read from the chart are:
| Year | Sales (₹ lakh) | Profit % |
|---|---|---|
| 2019 | 200 | 20% |
| 2020 | 250 | 14% |
| 2021 | 300 | 12% |
| 2022 | 280 | 15% |
| 2023 | 320 | 10% |
In which year was the profit the highest, and what was it?
(a) 2019, ₹40 lakh (b) 2021, ₹36 lakh (c) 2022, ₹42 lakh (d) 2023, ₹32 lakh
Solution
Step 1: Read both graphs for each year. The sales values come from the bars and the profit percentages from the line.
Step 2: Calculate the profit for each year.
- 2019: 200 × 20/100 = 40
- 2020: 250 × 14/100 = 35
- 2021: 300 × 12/100 = 36
- 2022: 280 × 15/100 = 42
- 2023: 320 × 10/100 = 32
Step 3: Compare. The highest value is 42, in 2022.
Answer: c
How to Solve These Questions
Follow this step-by-step method during your exam.
Step 1: Scan the Data (10–15 Seconds)
Look at the chart or table to identify totals and subtotals, trends (increasing or decreasing), the highest and lowest values, and the overall data format.
Step 2: Read the Questions First
Scanning the questions before reading the full chart tells you exactly what to look for, which calculations you’ll need, and saves time by letting you skip irrelevant information.
Step 3: Identify the Type of Question
Determine whether it’s a direct calculation from visible data, a percentage or ratio comparison, a trend analysis, a data sufficiency check, or logical reasoning built on arithmetic.
Step 4: Select the Correct Formula
Choose the formula that matches what’s given and what you’re solving for.
Step 5: Apply Approximation When Possible
When the answer options are far apart, round off values to simplify mental math rather than calculating exact figures unnecessarily.
Step 6: Use the Elimination Technique
Rule out options that are obviously wrong first — this narrows your choices and saves time even before you finish calculating.
Step 7: Verify Your Answer
Check that the result is logical: percentages should be reasonable, ratios should be in their simplest form, averages should fall between the minimum and maximum values, and pie chart angles should sum to 360°.
Effective Tricks to Solve These Questions
Trick 1: Scan the Questions First
👉 Read the questions before working through the entire chart, so you know exactly what to look for.
Trick 2: Use Approximation and Estimation
👉 Round off numbers when an exact answer isn’t required — this speeds up mental math considerably when the answer options are clearly spaced apart.
Trick 3: Compare Ratios Instead of Full Calculations
👉 Use ratio or percentage relationships directly rather than calculating every individual value when only a comparison is needed.
Trick 4: Use the Elimination Technique
👉 Work with the answer options to rule out the obviously wrong ones and narrow down your choices before finishing the calculation.
Trick 5: Use Common Multiples for Comparing Fractions
👉 Cross-multiply fractions instead of converting each one to a decimal — it’s faster and avoids rounding errors.
Trick 6: Memorize Fraction-Percentage Equivalents
👉 Converting a percentage into its simple fraction equivalent avoids long decimal calculations and speeds up DI questions significantly.
Trick 7: Scan Visually Before Reading Questions
👉 Circle the highest and lowest values on a chart before diving into the questions, so you already have a mental map of the data.
Trick 8: Look for Hidden Values
👉 If the total isn’t given directly, look for clues elsewhere in the data that let you derive it.
Trick 9: Identify the Chart Type Quickly
👉 Recognizing whether you’re dealing with a bar graph, pie chart, line graph, table, or caselet tells you immediately which approach to apply.
Trick 10: Practice Mental Math Daily
👉 Regular practice with multiplication tables, squares, cubes, and percentage equivalents can cut calculation time by 30–40%.
Important Tips to Solve These Questions
Common Mistakes to Avoid
👉 Reading the chart before the questions — this wastes time absorbing details you may never need; scan the questions first.
👉 Calculating exact values when approximation would do — over-precision slows you down without changing which option is correct.
👉 Confusing percentage of total with percentage change — these use different formulas and are easy to mix up under pressure.
👉 Ignoring units across a mixed chart — bars and lines in a combination chart often use different scales; check the axis labels carefully.
👉 Skipping verification on pie chart questions — the sector angles should always sum to 360°; use this as a built-in check.
Quick Solving Checklist
Before selecting your answer, use this checklist:
👉 Read the questions first.
👉 Scanned the chart or table for totals and trends.
👉 Identified the data format (bar, pie, line, table, or caselet).
👉 Selected the correct formula.
👉 Used approximation where possible.
👉 Applied the elimination technique.
👉 Performed the calculations carefully.
👉 Verified the answer makes logical sense.
👉 Avoided spending too much time on one question.
Practice Questions
Conclusion
Mastering the Data Interpretation and Arithmetical Reasoning Test is essential for the Nepal Army Officer Cadet Entrance Examination. Success requires systematic application of analytical skills, numerical ability, and logical reasoning — not guesswork — across scenarios involving tables, charts, graphs, caselets, and arithmetic logic problems.
Follow this disciplined approach:
Scan → Read Questions → Identify Format → Apply Formula → Calculate → Verify → Answer
Regular practice enhances pattern recognition, speed, logic, and accuracy. With the right shortcuts, approximation techniques, and consistent practice, you can dramatically reduce problem-solving time while maintaining accuracy.
This resource is part of the Officer Cadet Entrance Exam Preparation series, focusing on IQ and Logical Reasoning for the Nepal Army Officer Cadet Entrance Exam. For structured lessons, comprehensive practice banks, and mock tests, explore the Data Interpretation and Arithmetical Reasoning Test Course on the Pratima Academy LMS.