
Venn Diagrams and Figure Matrices IQ Test is an important part of IQ and Logical Reasoning that tests your ability to understand relationships between groups and identify patterns in visual grids.
For Officer Cadet Entrance Exam preparation, these questions help develop analytical thinking, pattern recognition, spatial visualization, and logical reasoning skills. Explore the complete Officer Cadet Exam resources and IQ for Officer Cadet preparation for additional practice and study materials.
- What are Venn Diagrams and Figure Matrices Test?
- What Skills Do These Questions Measure?
- Important Terms and Definitions
- Fundamental Concepts: Venn Diagrams Test
- Fundamental Concepts: Figure Matrix Test
- Types of Venn Diagram and Figure Matrix Questions
- 1. Venn Diagram Identification
- 2. Completely Unrelated Groups
- 3. One Group Inside Another
- 4. Analysis-Based Venn Diagrams
- 5. Figure Matrix: Addition Pattern
- 6. Figure Matrix: Subtraction Pattern
- 7. Figure Matrix: Counting Pattern
- 8. Figure Matrix: Rotation Pattern
- 9. Figure Matrix: Superimposition Pattern
- 10. Figure Matrix: Multiple Feature Changes
- How to Solve Venn Diagram Questions
- How to Solve Figure Matrix Questions
- Effective Tricks to Solve These Questions
- Important Tips to Solve These Questions
- Practice Questions
- Conclusion
- Related Resources
What are Venn Diagrams and Figure Matrices Test?
Venn Diagrams Test
A Venn Diagrams Test is a reasoning test that assesses your ability to understand and analyze relationships among different groups or categories using overlapping circles. It tests skills such as identifying common and separate groups, interpreting intersections, and determining which diagram correctly represents given relationships.
Example:
Which diagram best depicts the relationship among Professors, Researchers, and Scientists?
Solution:
Some professors are also researchers (and vice versa), so the “Professors” and “Researchers” circles must overlap. Both groups fall under the broader category of “Scientists,” so both circles must be enclosed within a larger circle.
Answer: Two intersecting circles enclosed by a third larger circle.
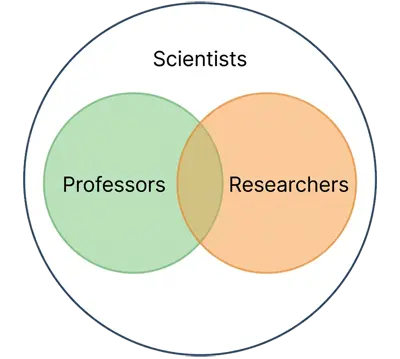
Figure Matrices Test
A Figure Matrices Test is a non-verbal reasoning test that assesses your ability to identify patterns, relationships, and transformations among figures arranged in a matrix. It tests skills such as recognizing changes in shape, position, rotation, shading, number, and the combination or removal of elements to determine the missing figure.
Example:
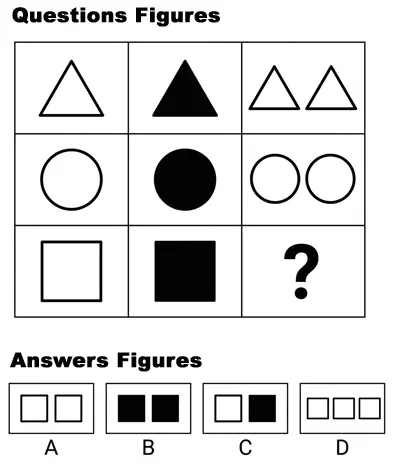
Which figure completes the matrix?
Solution:
👉 Col 1 → Col 2: Same shape, white becomes black.
👉 Col 2 → Col 3: Shape returns to white and is doubled.
👉 So, the missing figure is two white squares.
Answer: A
What Skills Do These Questions Measure?
Venn diagram and figure matrix questions test your ability in:
👉 Analytical and logical thinking – working out relationships and rules methodically
👉 Pattern recognition and relationship identification – spotting how groups or figures relate to each other
👉 Visual-spatial reasoning – interpreting overlapping regions and grid arrangements correctly
👉 Understanding of set theory concepts – applying ideas like intersection, union, and containment
👉 Attention to detail – catching subtle differences between candidate answers
👉 Systematic problem-solving – testing one relationship or feature at a time rather than guessing
👉 Speed and accuracy – solving visually dense problems within exam time limits
This combined topic is a high-scoring area in the Non-Verbal Reasoning section because questions follow predictable patterns and test fundamental cognitive abilities.
Important Terms and Definitions
👉 Venn diagram – a diagram using overlapping shapes to show logical relationships between sets or groups
👉 Figure matrix – a rectangular arrangement of figures where each follows a specific rule, with one figure missing
👉 Set – a collection of distinct objects or elements sharing a common characteristic
👉 Intersection – the overlapping region of two or more sets, representing elements belonging to all of them
👉 Union – the combination of all elements from two or more sets
Fundamental Concepts: Venn Diagrams Test
Venn diagrams represent groups using circles or other shapes; overlapping areas represent elements belonging to multiple groups, and non-overlapping areas represent elements exclusive to one group. Recognizing the type of relationship at play is essential — two unrelated groups both inside a larger third group, two groups with common elements both inside a larger third group, one group nested entirely inside another with a third completely unrelated group, or three groups that are all completely unrelated to each other. In analysis-based questions, each region represents a specific combination of characteristics, and the region inside multiple shapes represents elements belonging to all of those categories at once.
Fundamental Concepts: Figure Matrix Test
Look at rows first, then columns, identifying changes in rotation, number, shape, or shading. Figures can change in several ways simultaneously — shape, count, rotation, shading, and position — so the same rule should hold consistently across every row and column you check. Common patterns include addition (the third figure combines elements of the first two), subtraction (the third figure contains only elements not common to the first two), rotation, counting changes, superimposition, and sequencing.
Types of Venn Diagram and Figure Matrix Questions
For Officer Cadet preparation, these questions may involve:
1. Venn Diagram Identification
These questions require you to select the Venn diagram that correctly represents the relationships described among different groups or categories.
Example:
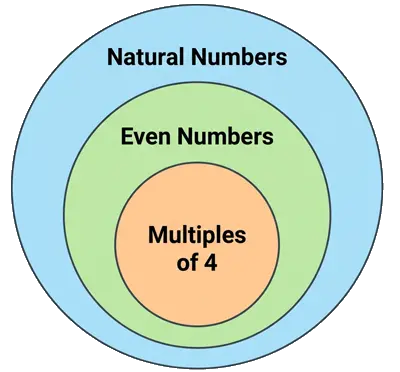
Which diagram best represents the relationship among Even Numbers, Multiples of 4, and Natural Numbers?
Solution:
A large circle representing Natural Numbers, containing a smaller circle for Even Numbers, with another smaller circle for Multiples of 4 completely inside the Even Numbers circle.
Explanation: Every multiple of 4 is an even number, and every even number is a natural number.
2. Completely Unrelated Groups
These questions require you to identify a diagram in which the given groups have no common members or overlap.
Example:
Which diagram represents the relationship among Doctors, Rivers, and Chairs?

Answer:
Three separate, non-intersecting circles.
Reasoning:
These three categories share no common members — a doctor is not a river, a river is not a chair, and a chair is not a doctor. Therefore, they are disjoint sets and must be shown as three completely separate circles.
3. One Group Inside Another
These questions test your ability to identify when one group is completely contained within another group, while other groups remain separate.
Example:
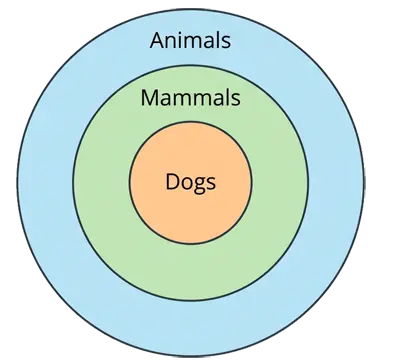
Which of the following best represents the relationship shown in this diagram?
A. Dogs, Mammals, and Animals are three separate categories with no common members.
B. All dogs are mammals, and all mammals are animals.
C. Some dogs are mammals, and some mammals are animals.
D. Animals are a subset of Mammals, and Mammals are a subset of Dogs.
Solution
Answer: B. All dogs are mammals, and all mammals are animals.
Reasoning:
The diagram shows nested circles (one inside another):
| Relationship | Meaning |
|---|---|
| Dogs inside Mammals | Every dog is a mammal. |
| Mammals inside Animals | Every mammal is an animal. |
| Dogs inside Animals | Every dog is also an animal. |
This is a hierarchical (subset) relationship:
Dogs ⊂ Mammals ⊂ Animals
4. Analysis-Based Venn Diagrams
These questions require you to examine a given Venn diagram and identify the region that satisfies a particular combination of conditions.
Example:
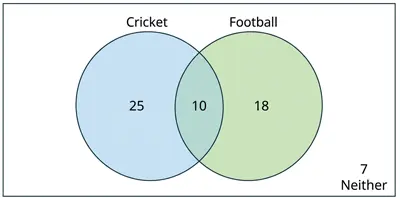
In a class of 60 students, 35 play cricket, 28 play football, and 10 play both. How many students play only cricket, only football, and neither?
Answer:
Only cricket = 25, only football = 18, neither = 7
Solution:
Start with the overlap. Both = 10.
Only cricket = 35 − 10 = 25
Only football = 28 − 10 = 18
Total playing at least one game = 25 + 18 + 10 = 53
Neither = 60 − 53 = 7
5. Figure Matrix: Addition Pattern
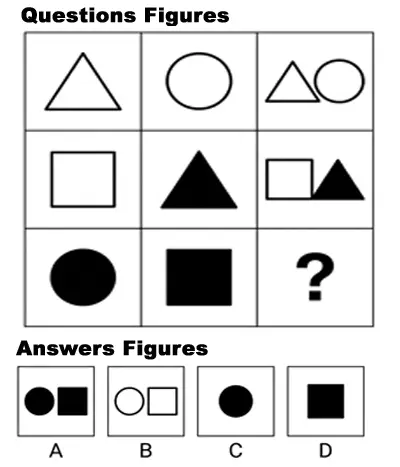
In this type of question, the third figure is formed by combining the elements of the first and second figures in each row or column.
Example:
Which figure completes the matrix?
Solution:
👉 Col 1: (black circle)
👉 Col 2: (black square)
👉 Col 3: (both elements together)
Addition Pattern: The third figure contains all elements from the first and second figures combined — nothing is removed or changed.
Answer: A
6. Figure Matrix: Subtraction Pattern
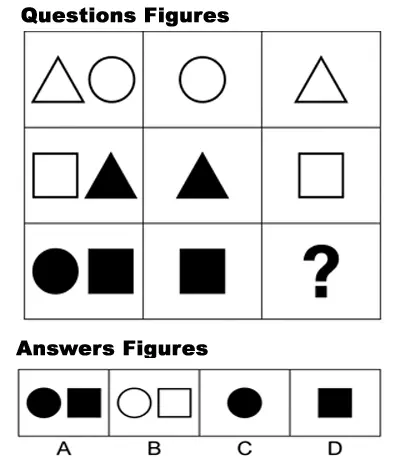
In this type of question, the third figure is formed by removing common elements or specific parts of one figure according to a consistent rule.
Example:
Which figure completes the matrix?
Solution:
👉 Col 1: (black circle and black square)
👉 Col 2: (black square)
Remove the common element (black circle remains)
Subtraction Pattern: The third figure contains only the elements left over after removing the common element from the first figure.
Answer: C
7. Figure Matrix: Counting Pattern
These questions require you to identify a numerical relationship between the number of elements in different figures.
Example:
Which figure completes the matrix?
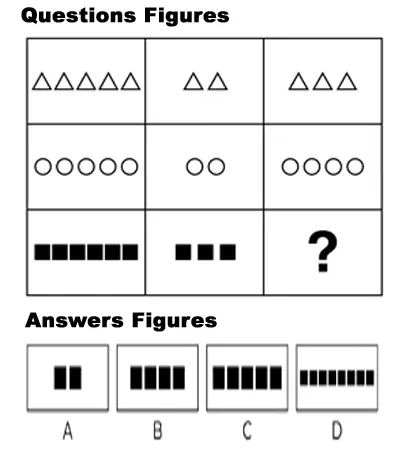
Solution:
👉 Col 1: 7 squares
👉 Col 2: 3 squares
👉 Col 3: 7 − 3 = 4 squares
Counting Pattern: The number of elements in the third figure equals the difference between the numbers in the first and second figures.
Answer: B
8. Figure Matrix: Rotation Pattern
These questions involve a consistent rotational movement of shapes or elements from one figure to another.
Example:
Which figure completes the matrix?
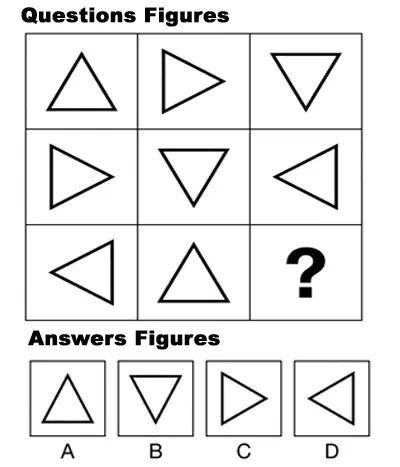
Solution:
👉 Col 1: (pointing left)
👉 Col 2: (pointing up) — rotated 90° CW ✓
👉 Col 3: Rotate △ another 90° CW → ▷ (pointing right)
Rotation Pattern: Each figure in the row is obtained by rotating the previous figure 90° clockwise. Applying the same rotation three times returns the shape to its original orientation.
Answer: C
9. Figure Matrix: Superimposition Pattern
These questions require you to overlay or combine elements from two or more figures to determine the pattern and identify the missing figure.
Example:
Which figure completes the matrix?
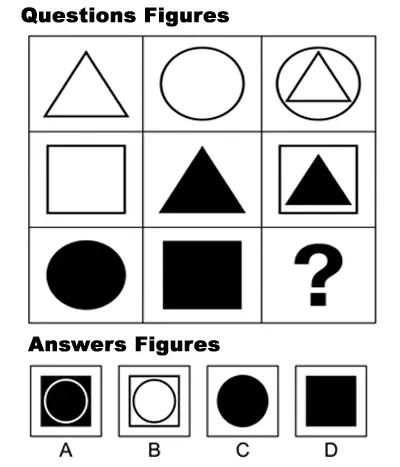
Solution:
👉 Col 1: ● (black circle)
👉 Col 2: ■ (black square)
👉 Col 3: ● inside ■ (both shapes overlaid)
Superimposition Pattern: The third figure is formed by overlaying the elements of the first two figures on top of each other — all elements are retained.
Answer: A
10. Figure Matrix: Multiple Feature Changes
These questions involve several changes simultaneously, such as shape, orientation, shading, position, and number of elements.
Example:
Which figure completes the matrix?
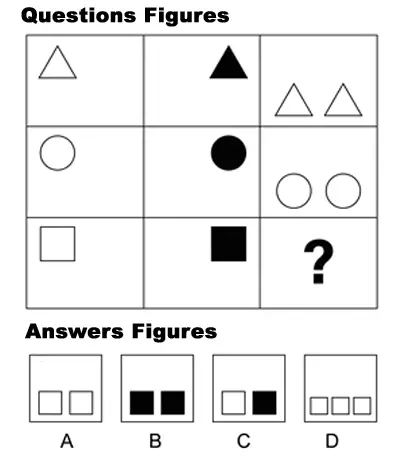
Solution:
👉 Shape: Same within row
👉 Shading: White → Black → White
👉 Number: 1 → 1 → 2
👉 Position: Top-left → Top-right → Bottom
Multiple Feature Changes: When several features change at once, analyze each feature independently across the row, then combine all rules to determine the missing figure.
Answer: A (two white squares, bottom)
How to Solve Venn Diagram Questions
Follow this step-by-step method during your exam.
Step 1: Identify the Groups
Read the question carefully and note every group or category mentioned.
Step 2: Determine the Relationships
Work out whether any groups are completely unrelated, whether one group fully contains another, whether groups partially overlap, or whether any groups share common elements.
Step 3: Match with the Correct Diagram Type
Based on the relationships you’ve identified, determine which diagram type accurately represents them.
Step 4: For Analysis-Based Questions
If a diagram with numbered regions is given, identify which shapes each region falls inside, work out what each region represents, and then answer the specific question asked.
Step 5: Verify
Confirm that your chosen diagram correctly represents every relationship described in the question, not just some of them.
How to Solve Figure Matrix Questions
Follow this step-by-step method during your exam.
Step 1: Analyze the Pattern
Look at rows and columns systematically, checking for changes in rotation, number of elements, shape, shading, or position.
Step 2: Focus on One Feature at a Time
Deliberately isolate one attribute — shape orientation, then shading, then position, then count — to avoid confusion from several simultaneous changes.
Step 3: Identify the Rule
Determine whether the rule operates row-wise, column-wise, or in both directions at once.
Step 4: Apply the Rule
Use the confirmed rule to work out what the missing figure should look like.
Step 5: Verify with the Options
Match your predicted answer against the options and eliminate any that don’t fit every pattern you’ve identified.
Effective Tricks to Solve These Questions
Trick 1: Categorize Venn Diagram Relationships First
👉 Work out the relationship between the given groups before even looking at the answer options — this narrows your choices dramatically.
Trick 2: Use Elimination for Venn Diagrams
👉 Rule out any diagram option that clearly fails to represent the relationship you’ve identified.
Trick 3: Check That All Groups Are Represented
👉 Make sure your chosen diagram correctly represents every group mentioned in the question, not just some of them.
Trick 4: Scan Rows First, Then Columns in Figure Matrices
👉 Read across the top row first and look for the most obvious single change, then check whether the same pattern holds in the other rows and down the columns.
Trick 5: Solve Figure Matrix Features Independently
👉 When several features change at once, isolate and solve for each one separately — shape orientation, then shading, then position, then count.
Trick 6: Name One Variable at a Time
👉 Deliberately ignore every attribute except the one you’re currently checking to avoid confusion from simultaneous changes.
Trick 7: Check the Common Patterns First
👉 Test rotation, addition, subtraction, and combination before assuming a more complex or unusual pattern is at play.
Trick 8: Use Elimination in Figure Matrices Too
👉 Rule out any option that clearly conflicts with the rule you’ve already confirmed in the matrix.
Trick 9: Try Column-Wise or Diagonal Patterns if Rows Don’t Work
👉 If a rule doesn’t hold across every row, check whether it instead works column-wise or along a diagonal.
Trick 10: Verify Against Every Row and Column
👉 A correct rule should hold across all rows and all columns, not just the one direction you happened to check first.
Important Tips to Solve These Questions
Common Mistakes to Avoid
👉 Overlooking partial overlap in Venn diagrams — some categories genuinely share members; don’t assume every relationship is either fully separate or fully contained
👉 Assuming all relationships are simple — real exam questions often combine several relationship types in one diagram
👉 Ignoring multiple simultaneous changes in figure matrices — figures can shift in shape, shading, and position all at once; check each feature independently
👉 Rushing to the first apparent pattern — always verify a rule against every row and column before committing to it
👉 Checking only row-wise or only column-wise — a real rule may only reveal itself when you check both directions
Quick Solving Checklist
Before selecting your answer, use this checklist:
👉 Identified all groups and their relationships (for Venn diagrams)
👉 Matched the relationships with the correct diagram type
👉 Scanned rows first, then columns (for figure matrices)
👉 Identified one feature at a time
👉 Checked for rotation, addition, subtraction, and combination patterns
👉 Eliminated options that conflict with the identified pattern
👉 Verified the rule works for all rows and columns
👉 Avoided spending too much time on one question
Practice Questions
Conclusion
Mastering the Venn Diagrams and Figure Matrices Test is essential for the Nepal Army Officer Cadet Entrance Examination. Success requires systematic analysis of relationships and patterns — not guesswork — across scenarios involving set relationships, overlapping regions, visual grids, and figure transformations.
Follow this disciplined approach:
Analyze → Identify Rule → Apply → Verify → Answer
Regular practice enhances pattern recognition, analytical thinking, speed, and accuracy — skills that matter for officers who must quickly analyze complex information, identify relationships, and make accurate decisions under pressure.
This resource is part of the Officer Cadet Entrance Exam Preparation series, focusing on IQ and Logical Reasoning for the Nepal Army Officer Cadet Entrance Exam. For structured lessons, comprehensive practice banks, and mock tests, explore the Venn Diagrams and Matrices Test subtopic under the Non-Verbal Reasoning topic in the IQ and Logical Reasoning course on the Pratima Academy LMS.